Findify can personalize all the major touchpoints on your store: search, category navigation, and multi-page recommendations. Of this stack, one of the most complex touchpoints to personalize is search — and it’s also the most essential one.
Search users are customers with a high level of purchase intent, and to be able to harness that intent by delivering a truly unique experience to each and every user is an invaluable competitive advantage. There are thousands of knobs you can tune to make search results better, but at Findify we’ve been teaching the machine to automatically make the best ranking decisions for you.
Read on to learn the story of Findify’s technological (r)evolution.
How generic search works and what’s wrong with it
When a new customer visits an online store and decides to search for headphones, she types ‘headphones’ in a search box, hits a button, and then receives a list of matching products for her query. Nothing could be more straightforward, right?
Think again. According to our statistics (collected from more than 1,000 merchants over the course of a one week research period):
- 45% of users perform only a single search. If they don’t find a relevant product on the first try, they will move on to another site.
- 75% of users never leave the first page of search results.
- 50% of all clicks made in search results are within the first 5 products listed.
In other words, the way search results are ordered is EVERYTHING. Hey, it’s 2020, and shoppers don’t have the patience to scroll through search results they perceive as non-relevant.
A standard search engine embedded in your shopping platform uses proven, open-source technologies such as ElasticSearch (Bigcommerce) or Solr (Shopify) — which, under the hood, use generic algorithms [TF/IDF, BM25] to rank search results. These algorithms match terms in a search query only to terms found in product descriptions, nothing more. But an online store has much richer metadata about their products and customers:
- Some products are more popular than others.
- Prices vary.
- The customer already viewed a couple of products before performing a search, giving us information about his or her interests.
- Some products have better ratings than others.
- Customers are shopping from different countries.
- Customers are using different device types and platforms.
All these valuable snippets of information are typically ignored by standard search engines like ElasticSearch, giving customers less relevant results.
Improving search quality
Before taking steps to improve your search quality, you need to understand how that quality is measured in the first place. In the search engine industry, two groups of metrics are used:
- Relevance-related metrics like NDCG: if users tend to click on items ranked higher in search results, it’s considered a search quality win.
- Business-related metrics [conversion, average order value]: if users tend to buy more using a better search, it’s a search quality win-win.
In an early version of our search engine we used a limited set of features to improve search results ranking. Simply put, for each product in the search results we applied a set of rules:
- If the current product gets more clicks and pageviews for this query than on average, boost its ranking.
- If this product is also more frequently bought for this particular query, boost its ranking even higher.
Using these two simple rules to re-rank products in search results yielded, in general, a 5–10% improvement in user search experience in terms of both relevance- and business-related metrics.
If such a simple approach gave such measurably positive results, imagine the dramatic boost to search quality and merchant revenue if we go further, if we integrate all the data we collect from a merchant’s user activity into a single model. Enter the “learning to rank” family of machine-learning models: RankNet, LambdaRank and LambdaMART.
LambdaWHAT?
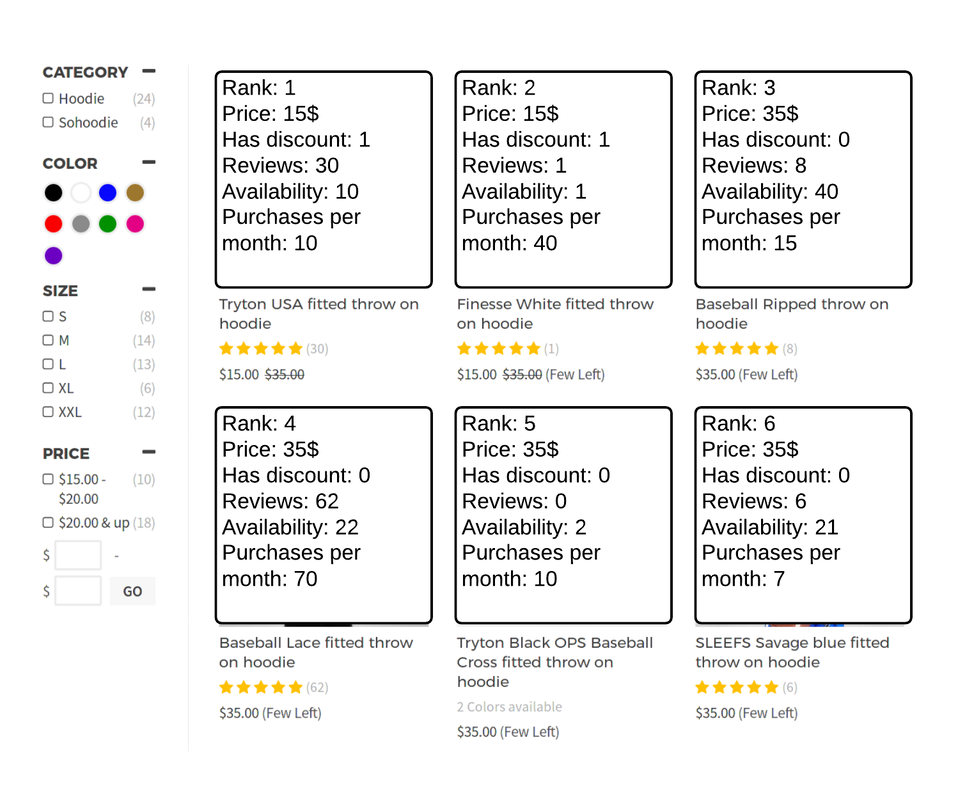
By the time a customer looks at the search results, we can already assume a lot about the search query itself, the products shown there, and past user behavior. This knowledge can be expressed as feature values, a set of numbers characterizing the importance of each small bit of collected data. The number of these feature values is limited only by the developer’s imagination. At Findify we use about 60 of them.
Through the feature values prism, our search algorithm sees the search results in this way:

This might look like a set of random numbers, but when you collect a month of user search activity you start noticing that some feature values carry more weight in results ranking for a particular query. For example, more product reviews lead to a higher click probability, but the review score itself has surprisingly little correlation with clicks.
You also notice that the picture above focuses only on product-specific feature values like product price and number of reviews. But there are two other important classes of feature values: user-specific and search-specific.
User-specific ones are dependent not on the products shown in the search results, but on user behavior, for example:
- User’s device platform: is it mobile or desktop?
- The current product is similar to a previously viewed one.
- Location: is the user from the US, the EU, or elsewhere?
Search-specific feature values depend on the search query itself, for example:
- What is the average click rank for this query?
- How much time do users spend dwelling on search results of this query before clicking?
- Is it a high-frequency query or an unusual one?
- How many products were found?
Here’s a simple example to demonstrate the way we can weight these feature values to produce a better search ranking. For a merchant selling shoes, a new visitor looking for “men’s boots” got these search results:

Another visitor, looking for “winter shoes,” got another set of results:

You may notice that in both cases, users prefer clicking on a cheaper but more popular product. One response would be to then alter the ranking algorithm in such way that cheaper and popular products will get better ranking. But how hard can we boost them before we start ruining user search experience?
You can compute the best weights for price, popularity, and similarity using linear regression; this mathematical technique allows you to predict an event (in this case, a click) based on an input set of feature values. For the search results above the weights are shown below:

Thus we can assume that:
- High price has a strong negative impact on click probability.
- Product popularity has a moderate positive impact.
- The similarity to a previously viewed product is not as important as the other two feature values.
And just like that, we have built a simple — but real — machine learning model to predict user clicks on search results!
Using this model we can reorder the product for the first query, “men’s boots,” in the following way, the higher weight meaning a more relevant product:

In re-ranking these search results we’ve swapped the first two products, since the “Green boots” have a much higher weight according to our model.
Linear regression-based modeling is a good fit for simple cases, when you have only a couple of independent but descriptive feature values. In the real world, however, where creating more relevant search results means taking into consideration hundreds of feature values and millions of search results, you need a stronger machine learning algorithm — like LambdaMART.
LambdaMART is a learn-to-rank algorithm developed a few years ago by Microsoft. It far outshines the data-mining competition in producing high-quality search rankings, thanks to the following features:
- It has a number of battle-tested open-source implementations (XGBoost, LightGBM, CatBoost).
- It can handle vast numbers of feature values and scales well on very large data sets.
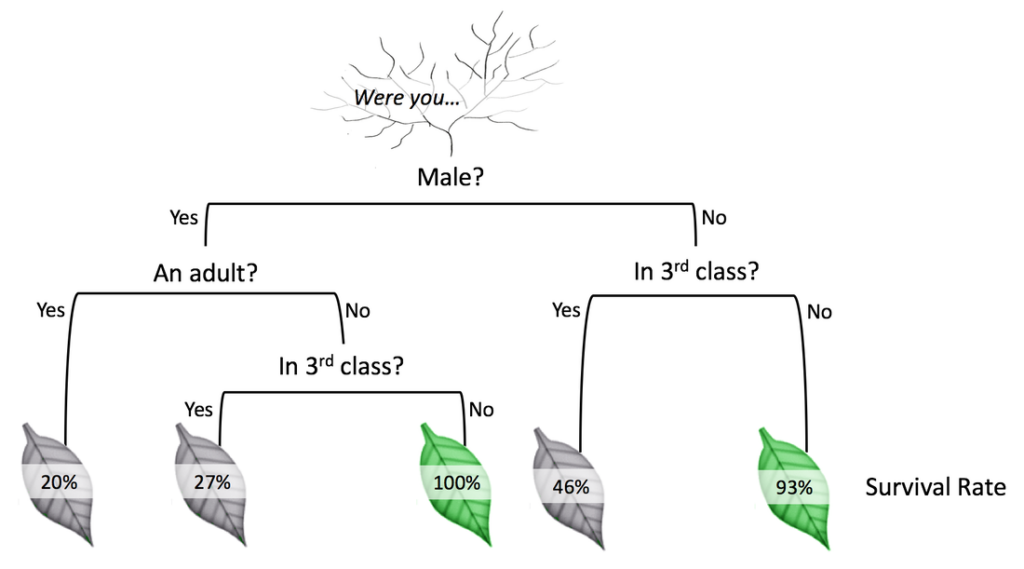
LambdaMART’s approach is based on a specific way of building a collection of decision trees. A decision tree is a very simple data structure that models decisions — or states of being — and their outcomes. This one, for example, predicts passenger survival on the Titanic:

According to this decision tree (depth 3, with 3 feature values), if you were an adult male traveling in 3rd class, you probably weren’t getting on that Titanic lifeboat.
As LambdaMART learns it builds a set of trees where:
- The first tree tries to maximize search quality metrics.
- The second tree maximizes the search quality metrics, but on the residuals of the first one.
- Subsequent trees improve the residuals of the previous ones.
Combining a large set of simple tree predictors into a single strong model is called gradient boosting; at Findify we use 100–200 trees, each of depth 6–8 and with over 60 feature values, to achieve truly remarkable search quality results.
Going live
But the machine learning algorithm itself is only one aspect of the full solution. To achieve a truly personalized, meaningful search for each unique user, the whole data analytics pipeline needs to work in real time. At Findify, when a user clicks on a search result or views a product page, it takes less than a second to receive, process and update his or her profile, and it takes less than 10 milliseconds to compute personalized search results.
The problem with most machine learning models is that they are opaque black boxes: you cannot reliably explain why they arrive at a particular prediction. At Findify we measure search quality, before rolling ranking-related changes into production, by using back-testing:
- We extract all user actions performed for the last several weeks.
- These actions are fed into our personalization platform, which simulates real user behavior but at a dizzying pace: a week of data can be analyzed in 5 minutes.
- For each search inside this simulation, we re-rank products in a different way and measure the search quality improvement.
Back-testing simulation is a useful tool for performing a preflight sanity test, but it’s still a simulation. Real users can — and will — behave unpredictably. To measure search quality in real time, we monitor and collect these metrics:
- Average click rank and time to click — to see if overall search interaction became smoother for the user.
- Average cart value and conversion — to be sure the merchant will get better revenue.
- These metrics can be collected separately for specific traffic segments, allowing us to see the improvements on an A/B, or split-run, test.
Results
At Findify we’ve spent months running personalized searches, and the general results are quite astonishing. As an example, for one of our merchants, conversion increased by 5–10%, average click rank went down from 9 to 7 (this is a good thing), and NDCG is constantly 15% better.
Another merchant saw 25% increased revenue per user, while others have seen an 18% increase.
Other merchants we’ve observed have seen similar improvements. Surprisingly, search personalization rarely improves average order value, but consistently improves conversion.
[Written by ML Developer Roman Grebennikov]
* Want to find out what Findify can do for you and your business? Book a free demonstration with us here.


